Utilities
Utilities
This module contains some utility functions. For the moment, there is only
graphics_inset(): generates plots with insets
- kerrgeodesic_gw.utilities.graphics_inset(main, inset, position, **kwds)
Insert a graphics object as an inset into another graphics object.
This function compensates for the (current) lack of the inset functionality in SageMath graphics.
The output is not a SageMath graphics object but a Matplotlib object, of type
Figure.INPUT:
main– a SageMath graphics objectinset– a SageMath graphics object to be inserted intomainposition– a 4-uple(left, bottom, width, height)specifying the position and size of the inset (all quantities are in fractions of figure width and height)kwds– options passed to methodmatplotlib.figure.Figure.add_axes
OUTPUT:
a
matplotlib.figure.Figureobject
EXAMPLES:
sage: from kerrgeodesic_gw.utilities import graphics_inset
sage: g1 = plot(x*sin(1/x), (x, -2, 2), axes_labels=[r"$x$", r"$y$"])
sage: g2 = plot(x*sin(1/x), (x, -0.05, 0.05),
....:           axes_labels=[r"$x$", r"$y$"],fontsize=8, frame=True)
sage: figure = graphics_inset(g1, g2, (0.72, 0.4, 0.25, 0.25))
sage: figure
<Figure size 640x480 with 2 Axes>
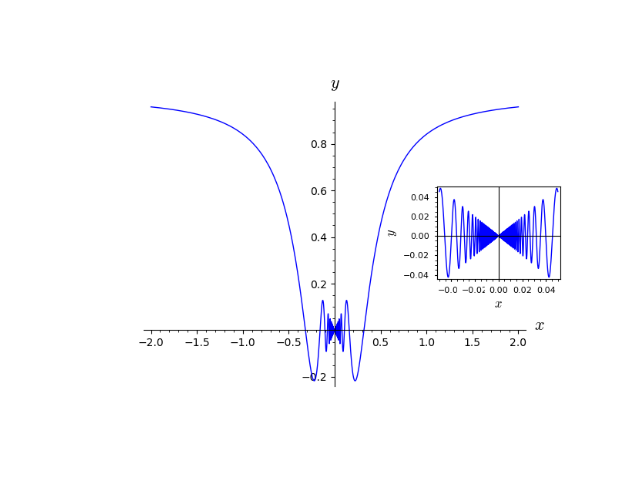
The output is a Matplotlib object, of type
Figure:sage: type(figure) <class 'matplotlib.figure.Figure'>
It can be saved into a pdf file via the method
savefig:sage: figure.savefig("figure.pdf")
An example with a Matplotlib keyword:
sage: figure = graphics_inset(g1, g2, (0.72, 0.4, 0.25, 0.25),
....:                         facecolor='yellow')
sage: figure
<Figure size 640x480 with 2 Axes>
